How scaphandre computes per process power consumption
Scaphandre is a tool that makes it possible to see the power being used by a single process on a computer.
This sounds like a simple thing to be able to do, but in practice a number of details can make this more complex.
So having a good mental model of how it works will make it easier to understand when and how to use Scaphandre. Let’s start with a simplified mental model below, before moving on to multiple processors or virtual machines - but once you understand the key ideas outlined below, it’s easier to see how they can be applied to thinking about tracking power on virtual machines, or when multiple processors are available.
How a computer works on multiple jobs at the same time
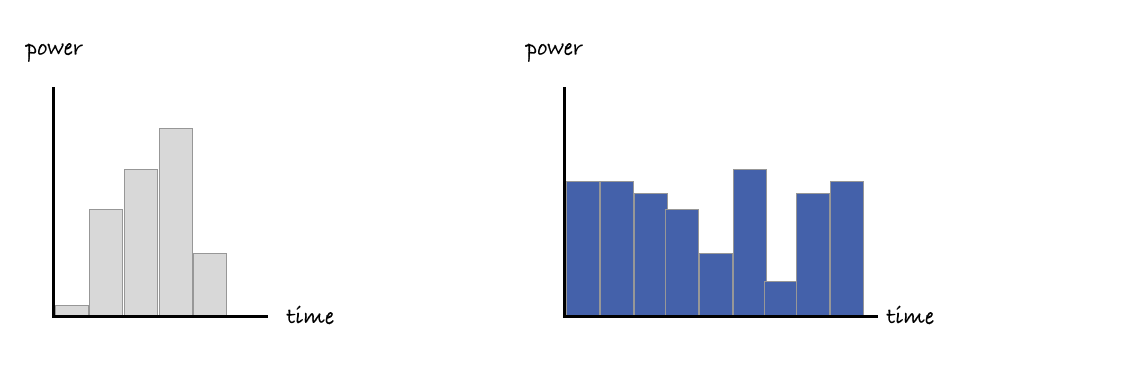
When we first think about how much energy a single process running in a computer might use, we might start with a mental model that looks like the figure below, with large, uninterrupted chunks of compute time allocated to each process.
This is easy to understand, and it matches how we might be billed for a share of a larger machine when paying for cloud services.
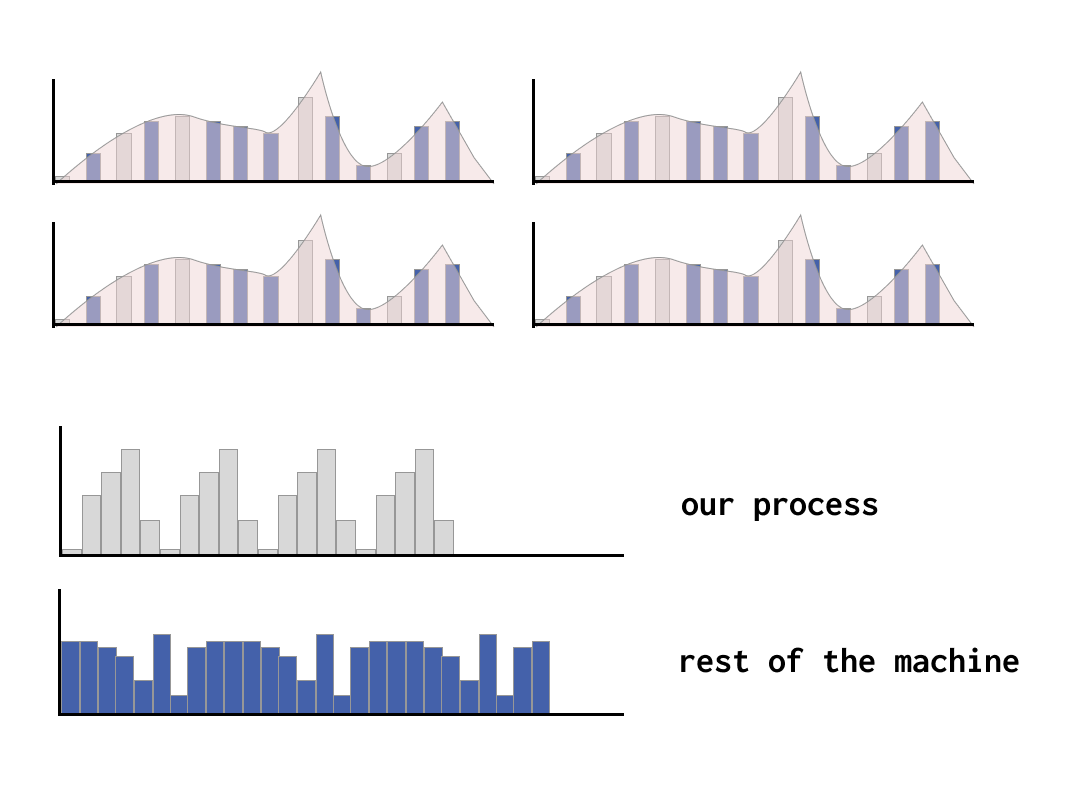
Timesharing of work
However, if the reality was exactly like this diagram, our computers would only ever be able to do one thing at a time. It’s more accurate and helpful to think of computers working on lots of different jobs at the same time - they work on one job for short interval of time, then another, and another and so one. You’ll often see these small intervals of time referred to as jiffies.

In a given amount of time, some jobs that are prioritized or more resource intensive will use more jiffies than others. Fortunately, each job keeps a running total of the total jiffies allocated to it, so if we know how many jiffies have been used in total, it can give us an idea how much of a machine’s resources are being used by a given process.

Going from share of resources to actual power figures
It’s possible without Scaphandre to understand how large a share of a machines’ resources are being used by a given process.
This is useful, by itself, but if we want to understand how much power is used per process, not just the share of the machine’s resources, we need to know how much power is being used by the machine in absolute terms.
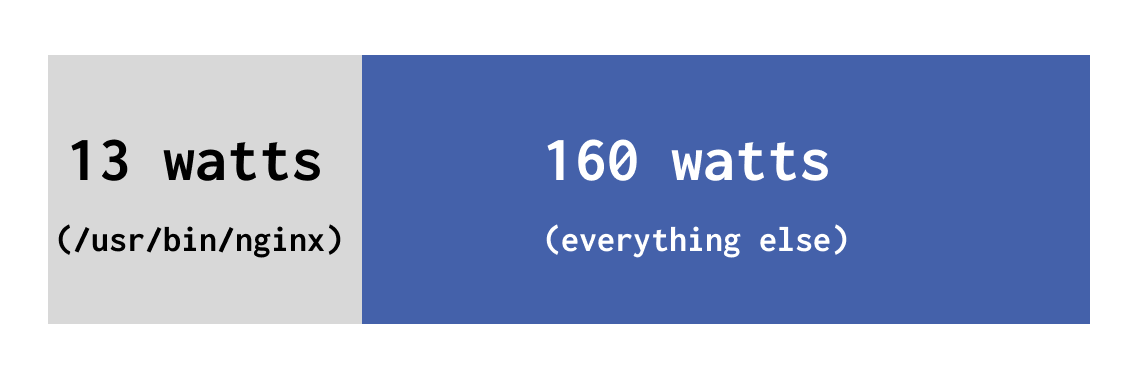
To do this, we need a sensor of some kind to track power usage by the machine itself. Some servers have these, like with Intel’s RAPL sensors, which we cover in more detail later on. This makes it possible to understand how much power is being used by CPUs, GPUs and so on, in terms of watts, or, if we are looking at just a single process, various fractions of a watt.
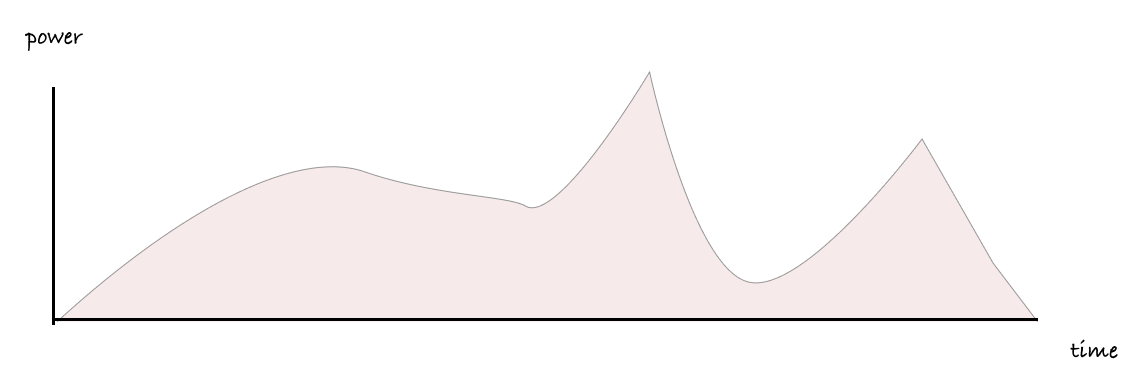
To understand the power used by a single process we combine both of these ideas. We count the jiffies used by our job when it’s being worked on, and for each jiffy, we check how much power is being drawn at those moments in time.
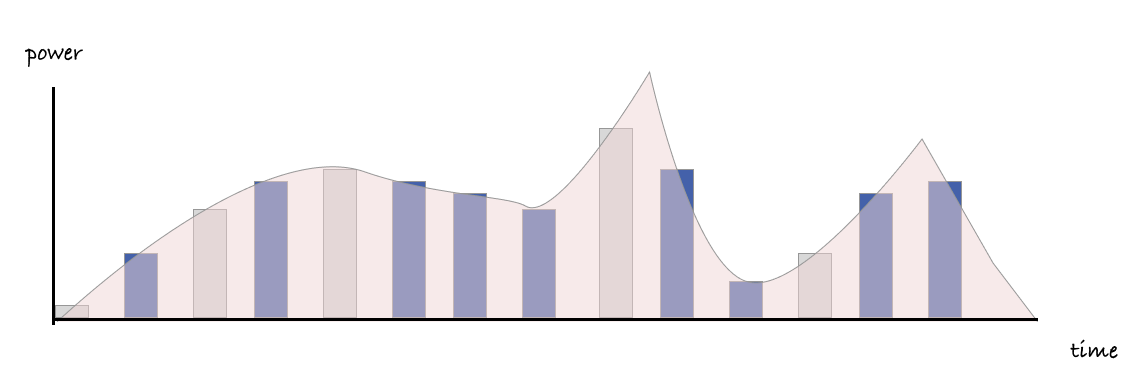
Finally, when we group together all the power readings for all our jiffies over a given time period, we can arrive at a usable figure for how much power has been used, in terms of watt hours.
Once we have a figure in terms of watt hours, there are various ways we can convert this to environmental impact. A common way is to use an emission factor for the electricity used, to turn the power consumption data into an estimate of associated carbon emissions.
Working with virtualisation and multiple processors
While the reality is again more complicated than the diagram below, the same ideas broadly apply when you introduce multiple processors too.
If you are able to read from sensors that can share how much power is being used by the various processors at work, and know how much of the time is being allocated to our processes during those moments, you can get a good idea of what these figures are, at a per-process level.
Things get a bit more complicated with virtualised environments, because in many cases, virtual machines only have a partial view of the system they are part of, and frequently do not have access to any power usage figures from the host physical machine.
However, if a guest virtual machine or guest container does have access to readings provided by the host physical machine, it is possible to work out the same kinds of per-process power figures. Scaphandre supports exposing these kinds of power readings to virtual machines and containers, which means, if you are running on infrastructure that is running scaphandre and exposing these readings, you can see these figures for the energy used by your own processes.
More details about how Scaphandre works
As you can see with the prometheus exporter reference, scaphandre exporters can provide process level power consumption metrics. This section will explain how it is done and how it may be improved in the future.
Some details about RAPL
We’ll talk here about the case where scaphandre is able to effectively measure the power consumption of the host (see compatibility section for more on sensors and their prerequisites) and specifically about the PowercapRAPL sensor.
Let’s clarify what’s happening when you collect metrics with scaphandre and the RAPL sensor. RAPL stands for Running Average Power Limit. It’s a technology embedded in most Intel and AMD x86 CPUs produced after 2012.
Thanks to this technology it is possible to get the total energy consumption of the CPU, of the consumption per CPU socket, plus in some cases, the consumption of the DRAM controller. In most cases it represents the vast majority of the energy consumption of the machine (except when running GPU intensive workloads, for example).
Further improvements shall be made in scaphandre to fully measure the consumption when GPU are involved (or a lot of hard drives on the same host…).
Between scaphandre and this data is the powercap kernel module that writes the energy consumption to files. Scaphandre reads those files, stores the data in buffers and then allows for more processing through the exporters.
How to get the consumption of one process ?
The PowercapRAPL sensor does actually more than just collecting those energy consumption metrics (and converting them to power consumption metrics).
Every time the exporter asks for a measurement (either periodically like in the Stdout exporter, or every time a request comes as would be the case for the Prometheus exporter) the sensor reads the values of the energy counters from powercap. It then stores those values, and does the same for the CPU usage statistics of the CPU (the one you can see in /proc/stats) and for each running process on the machine at that time (see /proc/PID/stats).
With this data it is possible to compute the ratio of CPU time actively spent for a given PID on the CPU time actively spent doing something. With this ratio we can then get the subset of power consumption that is related to that PID on a given timeframe (between two measurement requests).
How to get the consumption of an application/a service ?
Services and programs are often not running on only one PID. It’s needed to aggregate the consumption of all related PIDs to know what this service is actually consuming.
To do that, in the current state of scaphandre development, you can use the Prometheus exporter, and then use Prometheus and its query language capabilities. You’ll find examples looking at the graphs and queries here. In a near future, more advanced features may be implemented in scaphandre to allow such classification even if you don’t have access to a proper Time Series database (TSDB).