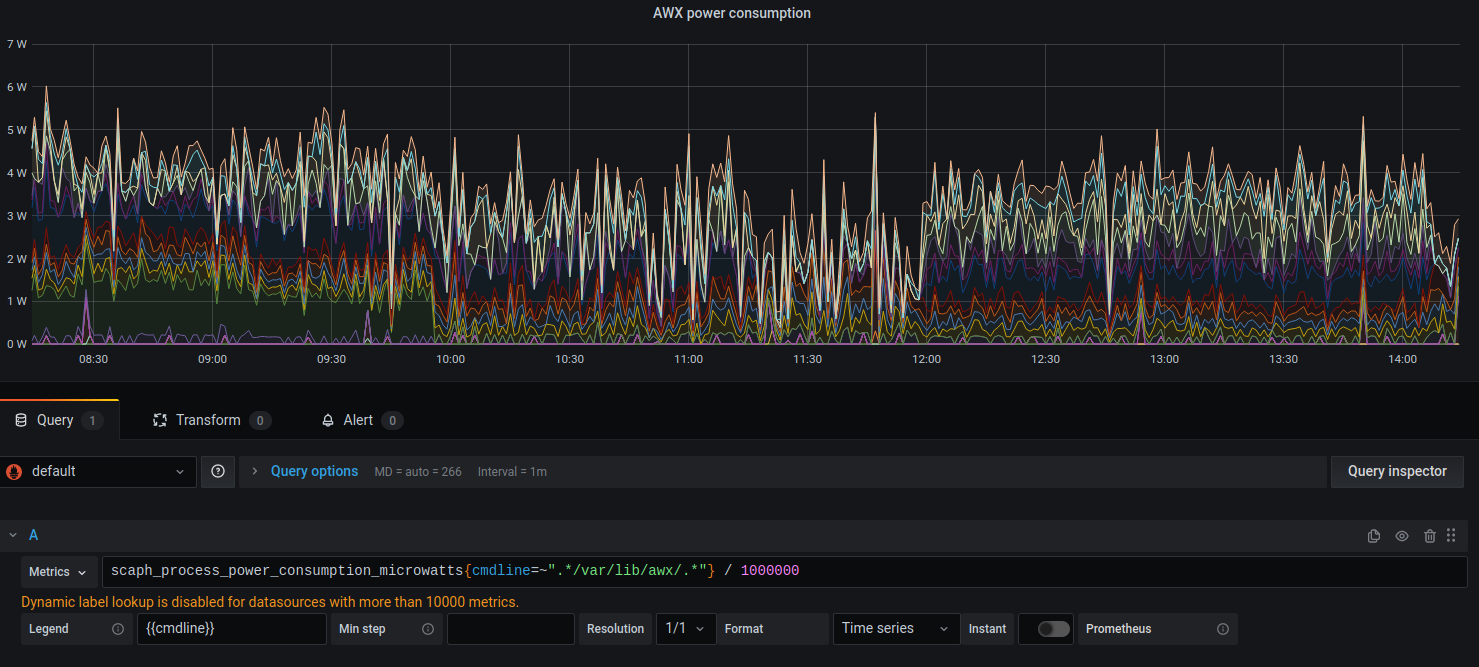
Get process-level power consumption in my grafana dashboard
Now we'll see how to get valuable data in a dashboard. Let's say you want to track the power consumption of a given process or application in a dashboard and eventually set thresholds on it. WHat do you need to get that subset of the power consumption of the host visually ?
You need basically 3 components for that:
- scaphandre running with the prometheus exporter
- prometheus
- grafana
We'll say that you already have a running prometheus server and an available grafana instance and that you have added prometheus as a datasource in grafana.
How to get metrics per process as you may see here ?
The metric that I need from the prometheus exporter to do that is: scaph_process_power_consumption_microwatts. This metric is a wallet for the power consumption of all the running processes on the host at a given time.
This is a prometheus metrics, so you have labels to filter on the processes you are interested in. Currently the available labels are: instance, exe, job and pid.
If I want to get power consumption (in Watts) for all processes related to nginx running on a host with ip 10.0.0.9 I may use that query, in grafana, based on the prometheus datasource:
scaph_process_power_consumption_microwatts{cmdline=~".*nginx.*", instance="10.0.0.9:8080"} / 1000000
Here we assume that scaphandre/the prometheus exporter is running on port number 8080.
Here is how it looks, creating a panel in grafana:

Those labels are explained in much more detail here.