Introduction

Welcome on Scaphandre documentation.
Scaphandre is a monitoring agent, dedicated to energy consumption metrics. Its purpose is to help measuring and thus understanding tech services energy consumption patterns. This is key, in our opinion, to enable the tech industry to shift towards more sustainability. 💚
If at this point you think “why bother ?”, or if you want more details about this project’s motivations, please have a look at the why section.
If not and you want to proceed, just directly jump to the tutorials section.
If you need more in-depth, use-case oriented instructions, the how-to guides are here for you.
Explanations is about theoretical concepts behind scaphandre and the reasons for the technical choices that have been made so far.
If you are already using, hacking or exploring scaphandre and need precise informations about one of its components, go to the references section. (The code documentation itself is here).
Getting started
To install Scaphandre, depending on your platform, see:
- Installation on GNU/Linux section.
- Installation on Windows section.
If you want to contribute or just play with the code and need to compile Scaphandre, see :
Depending on your kernel version, you could need to modprobe the module intel_rapl or intel_rapl_common first:
modprobe intel_rapl_common # or intel_rapl for kernels < 5
To quickly run scaphandre in your terminal you may use docker:
docker run -v /sys/class/powercap:/sys/class/powercap -v /proc:/proc -ti hubblo/scaphandre stdout -t 15
Or if you downloaded or built a binary, you’d run:
scaphandre stdout -t 15
Running scaphandre on Fedora / CentOS Stream / RHEL (or any distribution using SELinux) with podman
Running scaphandre with podman on a distribution using SELinux may fail because of access denied to /proc files.
To make it work you should run scaphandre in privileged mode :
podman run --privileged ...
You’ll find explanation of this requirement here : #106.
Output
Here we are using the stdout exporter to print current power consumption usage in the terminal during 15 seconds.
You should get an output like:
Host:	9.391334 W	Core		Uncore		DRAM
Socket0	9.392    W	1.497082 W
Top 5 consumers:
Power	PID	Exe
4.808363 W	642	"/usr/sbin/dockerd"
4.808363 W	703	"/usr/bin/docker-containerd"
4.808363 W	1028	"/usr/local/bin/redis-server"
0 W	1	"/usr/lib/systemd/systemd"
0 W	2	""
------------------------------------------------------------
Let’s briefly describe what you see here. First Line is the power consumption of the machine (between the two last measurements). Second line is the power consumption of the first CPU socket plus the detail by RAPL Domain. If you have more than one CPU Socket, you’ll have multiple SocketX lines. Then you have the 5 processes consuming the most power during the last two measurements.
If you don’t get this output and get an error, jump to the Troubleshooting section of the documentation.
Going further
At that point, you’re ready to use scaphandre. The Stdout exporter is very basic and other exporters should allow you to use and send those metrics the way you like.
The prometheus exporter, for example, allows you to expose power consumption metrics as an HTTP endpoint that can be scrapped by a prometheus instance:
docker run -v /sys/class/powercap:/sys/class/powercap -v /proc:/proc -p 8080:8080 -ti hubblo/scaphandre prometheus
Here is the same command with a simple binary:
scaphandre prometheus
To validate that the metrics are available, send an http request from another terminal:
curl -s http://localhost:8080/metrics
Here you can see examples of graphs you can get thanks to scaphandre, the prometheus exporter, prometheus and grafana.
Installation (GNU/Linux)
Depending on your kernel version, you could need to modprobe the module intel_rapl or intel_rapl_common before running scaphandre:
modprobe intel_rapl_common # or intel_rapl for kernels < 5
Docker
To quickly run scaphandre in your terminal you may use docker:
docker run -v /sys/class/powercap:/sys/class/powercap -v /proc:/proc -ti hubblo/scaphandre stdout -t 15
Debian/Ubuntu
Since Debian Sid, Scaphandre is available as an official package, try:
sudo apt install scaphandre
If not (yet) in your official packages repositories, on Debian or Ubuntu, you can directly use the available .deb package for Debian Bullseye or the package for Debian Bookworm.
# For Debian Bookworm
VERSION="1.0.1" ARCH="amd64" DIST="deb12" && \
wget https://github.com/hubblo-org/scaphandre/releases/download/v${VERSION}/scaphandre_v${VERSION}-${DIST}_${ARCH}.deb && \
dpkg -i scaphandre_v${VERSION}\-${DIST}\_${ARCH}.deb && \
rm scaphandre_v${VERSION}\-${DIST}\_${ARCH}.deb
Run the binary
Once you downloaded or built a binary, you’d run:
scaphandre stdout -t 15
Here are some other ways to install scaphandre depending on your context:
- quickly try the project with docker-compose/docker stack
- run scaphandre on kubernetes
- run scaphandre on RHEL, with prometheus-push mode
Kudos to contributors who work on system packages, please have a try and/or contribute to:
- Debian package, maintainer: @barnumbirr
- NixOS package, maintainer: @mmai
Other tutorials should come, as:
- install scaphandre as a proper systemd service
- scaphandre in your favorite GNU/Linux distribution (need help from packaging gurus !)
- scaphandre on MacOSX
- and more…
Install Scaphandre on Windows
!! Warning: Windows version of Scaphandre is still in early stage. !!
Using the installer
Download the latest exe installer from the release page and install it as an administrator.
Configuring a Windows service to run Scaphandre in the background
For example, to run the prometheus-push exporter in the background and target the Prometheus Push Gateway server with ip address 198.51.100.5 using HTTPS on port 443 and a step to send metrics of 45s, without checking the certificate of the push gateway (remove that option if you have a properly signed TLS certificate):
sc.exe create Scaphandre binPath="C:\Program Files (x86)\scaphandre\scaphandre.exe prometheus-push -H 198.51.100.5 -s 45 -S https -p 443 --no-tls-check" DisplayName=Scaphandre start=auto
Ensure the service is started in Services.msc, start it by right clicking on it, then Start, otherwise.
To delete the service, you can do it in Services.msc, or:
sc.exe delete Scaphandre
Using an installer including a development version of the driver
If you are running a development version of the installer (which probably means a development version of the driver), you’ll need to enable Test Mode on Windows prior to proceed to this installation, then reboot.
bcdedit.exe -set TESTSIGNING ON
bcdedit.exe -set nointegritychecks on
Beware: in this case, activation of test mode and a reboot is needed before anyway.
Once installed, you should be able to run scaphandre from Powershell, by running :
& 'C:\Program Files (x86)\scaphandre\scaphandre.exe' stdout
Troubleshooting
An error such as
scaphandre::sensors::msr_rapl: Failed to open device : HANDLE(-1)
means that the driver is not properly setup. Check it’s state by running:
driverquery /v | findstr capha
If there is not item returned, the installation of the driver encountered an issue.
If the service is STOPPED, there is also something wrong.
Compilation
If you look for compiling Scaphandre and its driver yourself, see Compilation for Windows
Run a complete stack with docker-compose
If you’d like to try scaphandre and see the data in a decent visualization tool, there is a docker-compose in the repository to install scaphandre along side with prometheus and grafana.
Once you have cloned the repository, just move to the docker-compose folder and run the stack:
cd docker-compose
docker-compose up -d
Be warned: the sample stack runs scaphandre as a privileged container. Otherwise apparmor or equivalents might complain about ptrace calls on the host. See #135.
Grafana will be available at http://localhost:3000, the default username is admin and the password is secret.
Refresh the dashboard after 30s or enable auto-refresh and you should see the data filling the graphs.
The process_filter textbox on the top of the graph allows you to look at the power consumption of a single application or service. Type the name of the program you want to look at and press enter. In the Filtered process (process_filter) power, by exe graph, on the 3rd line, you should now see the power cosumption of the given program.
To remove the stack just run this command in the same folder:
docker-compose down
Compile scaphandre from source (GNU/Linux)
We recommand using the latest version available of the rust toolchain, as the tests are calling for the latest version before running.
To be sure to be up to date, you may install rust from the official website instead of your package manager.
To hack scaph, or simply be up to date with latest developments, you can download scaphandre from the main branch:
git clone https://github.com/hubblo-org/scaphandre.git
cd scaphandre
cargo build # binary path is target/debug/scaphandre
To use the latest code for a true use case, build for release instead of debug:
cargo build --release
Binary path is target/release/scaphandre.
Compilation for Windows (experimental)
Scaphandre, on Windows, needs a kernel driver to get the same metrics as it does with powercap on GNU/Linux. This driver is available on this repository. Please refer to this project to get either pre-compiled binaries (available soon) or to follow the compilation procedure.
Once you have a working driver, you can compile Scaphandre, with the Rust for Windows usual toolkit.
For now, all Scaphandre features are not supported on windows. Use the following command line to build the binary :
cargo build --no-default-features --features "prometheus json riemann"
Don’t forget to add the --release flag to build a binary suited for more than test and debug usecases.
Kubernetes
This tutorial uses Helm to install Scaphandre, Prometheus and Grafana.
Install Scaphandre
First we install Scaphandre which runs as a daemon set which creates a pod on each node for collecting the metrics. The helm chart is not in a repo, it needs to be installed from the source code.
git clone https://github.com/hubblo-org/scaphandre
cd scaphandre
helm install scaphandre helm/scaphandre
Parameters
Service monitor parameters
| Name | Description | Value |
|---|---|---|
serviceMonitor.enabled | Create ServiceMonitor Resource for scraping metrics using PrometheusOperator | false |
serviceMonitor.namespace | The namespace in which the ServiceMonitor will be created (if not set, default to namespace on which this chart is installed) | "" |
serviceMonitor.interval | The interval at which metrics should be scraped | 1m |
Security Parameters
| Name | Description | Value |
|---|---|---|
securityContext.privileged | Gives full host access, bypassing container isolation (can be needed to run on physical server) | false |
securityContext.runAsUser | Run as root user to get proper permissions | 0 |
securityContext.runAsGroup | Run as root group to get proper permissions | 0 |
Install Prometheus
Next we will install Prometheus which will scrape the metrics generated by Scaphandre.
helm repo add prometheus-community https://prometheus-community.github.io/helm-charts
helm repo add kube-state-metrics https://kubernetes.github.io/kube-state-metrics
helm repo update

helm install prometheus prometheus-community/prometheus \
--set alertmanager.persistentVolume.enabled=false \
--set server.persistentVolume.enabled=false
This setup should only be used for testing as the Prometheus data is not persisted if the pods are deleted.
You can access the Prometheus web UI by creating a port forwarding connection.
kubectl port-forward deploy/prometheus-server 9090:9090
Install Grafana
Create a configmap to store the Grafana dashboard.
kubectl create configmap scaphandre-dashboard \
    --from-file=scaphandre-dashboard.json=docs_src/tutorials/grafana-kubernetes-dashboard.json
Install Grafana.
helm repo add grafana https://grafana.github.io/helm-charts
helm repo update

helm install grafana grafana/grafana --values docs_src/tutorials/grafana-helm-values.yaml
Get the Grafana web UI password which is randomly generated.
kubectl get secret grafana -o jsonpath="{.data.admin-password}" | base64 --decode
Create a port forwarding connection to the Grafana pod.
kubectl port-forward deploy/grafana 3000:3000
Open Grafana in your browser at http://localhost:3000 the username is admin.
Cleaning up
Deleting the Helm releases will remove all the resources we created.
helm delete grafana prometheus scaphandre
Propagate power consumption metrics from hypervisor to virtual machines (Qemu/KVM)
Introduction
A major pain point in measuring power consumption is doing so inside a virtual machine. A virtual machine usually doesn’t have access to power metrics.
Scaphandre aims at solving that by enabling a communication between a scaphandre instance on the hypervisor/bare metal machine and another one running on the virtual machine. The scaphandre agent on the hypervisor will compute the metrics meaningful for that virtual machine and the one on the VM access those metrics to allow its user/administrator to use the data as if they had access to power metrics in the first place (as if they were on a bare metal machine).
This allows to break opacity in a virtualization context, if you have access to the hypervisor, or in a public cloud context if the provider uses scaphandre on its hypervisors.
How to
This is working on Qemu/KVM hypervisors only.
The idea is to run the agent on the hypervisor, with the qemu exporter:
scaphandre qemu
More examples for a production ready setup will be added soon (systemd service, docker container, …). If you think the documentation needs a refresh now, please contribute :)
For each virtual machine you want to give access to its metrics, create a tmpfs mountpoint:
mount -t tmpfs tmpfs_DOMAIN_NAME /var/lib/libvirt/scaphandre/DOMAIN_NAME -o size=5m
In the definition of the virtual machine (here we are using libvirt), ensure you have a filesystem configuration to give access to the mountpoint:
virsh edit DOMAIN_NAME
Then add this filesystem configuration block inside the <devices></devices> block:
<filesystem type='mount' accessmode='passthrough'>
    <driver type='virtiofs'/>
    <source dir='/var/lib/libvirt/scaphandre/DOMAIN_NAME'/>
    <target dir='scaphandre'/>
    <readonly />
</filesystem>
Save and (re)start the virtual machine.
If you get this error: “error: unsupported configuration: ‘virtiofs’ requires shared memory”, you might add this configuration section to the <domain> section.
<memoryBacking>
  <source type='memfd'/>
  <access mode='shared'/>
</memoryBacking>
Then connect to the virtual machine and mount the filesystem:
mount -t 9p -o trans=virtio scaphandre /var/scaphandre
You can now run scaphandre to export the metrics with the exporter of your choice (here prometheus):
scaphandre --vm prometheus
Please refer to the qemu exporter reference for more details.
Note: This how to is only suitable for a “manual” use case. For all automated systems like openstack or proxmox, some more work needs to be done to make the integration of those steps easier.
Get process-level power consumption in my grafana dashboard
Now we’ll see how to get valuable data in a dashboard. Let’s say you want to track the power consumption of a given process or application in a dashboard and eventually set thresholds on it. WHat do you need to get that subset of the power consumption of the host visually ?
You need basically 3 components for that:
- scaphandre running with the prometheus exporter
- prometheus
- grafana
We’ll say that you already have a running prometheus server and an available grafana instance and that you have added prometheus as a datasource in grafana.
How to get metrics per process as you may see here ?
The metric that I need from the prometheus exporter to do that is: scaph_process_power_consumption_microwatts. This metric is a wallet for the power consumption of all the running processes on the host at a given time.
This is a prometheus metrics, so you have labels to filter on the processes you are interested in. Currently the available labels are: instance, exe, job and pid.
If I want to get power consumption (in Watts) for all processes related to nginx running on a host with ip 10.0.0.9 I may use that query, in grafana, based on the prometheus datasource:
scaph_process_power_consumption_microwatts{cmdline=~".*nginx.*", instance="10.0.0.9:8080"} / 1000000
Here we assume that scaphandre/the prometheus exporter is running on port number 8080.
Here is how it looks, creating a panel in grafana:
Those labels are explained in much more detail here.
Install Scaphandre with only Prometheus-push exporter compiled, for Prometheus Push Gateway, on RHEL 8 and 9
Manual installation
Scaphandre can be compiled with a limited set of features. You have the choice to only install Scaphandre with prometheus-push exporter (alongside with stdout and json exporters, which might be useful locally).
RPM packages containing only those features are provided for RHEL 8 and 9 :
You can download it and install it just providing the right URL to dnf :
dnf install -y URL
Then you’ll probably need to change its configuration to target the appropriate Push Gateway server. Edit the configuration file :
vi /etc/scaphandre/prometheuspush
Default options look like :
SCAPHANDRE_ARGS="prometheus-push -H localhost -S http"
Those are prometheus-push exporter CLI options. Run the executable to get the reference of the options :
/usr/bin/scaphandre-prometheuspush --help
A simple configuration to target Push Gateway reachable on https://myserver.mydomain:PORT and send data every 30 seconds would look like :
SCAPHANDRE_ARGS="prometheus-push -H myserver.mydomain -S https -p PORT -s 30"
Once the configuration is changed, you can restart the service and ensure it is enabled as well for next reboot :
systemctl restart scaphandre-prometheuspush && systemctl enable scaphandre-prometheuspush
Configuration issues or issues to reach the push gateway should be visible in the logs :
systemctl status scaphandre-prometheuspush
Automatic installation with ansible
There is a sample Ansible playbook available in the automation/ansible folder of the project.
This can be used this way :
ansible-playbook -i inventory -b -u myunprivilegeduser -K install-configure-prometheuspush-rhel.yml
Beware of the playbook parameters :
rhel_version: 9
scaphandre_version: "dev0.5.10"
pushgateway_host: localhost
pushgateway_scheme: http
pushgateway_port: 9092
scaphandre_config_path: /etc/scaphandre/prometheuspush
service_name: scaphandre-prometheuspush
Ensure to change those to match your context, including changing rhel version if needed (8 and 9 are supported) and parameters to reach the Push Gateway on the network.
How To Start Implementing A New Sensor
This guide provides an overview of the internal architecture of sensors and the steps to implement a new sensor without touching exporter code.
Important Structs and Traits
First an overview of the the structs and traits defined in sensors/mod.rs.
pub struct Record {
    pub timestamp: Duration,
    pub value: String,
    pub unit: units::Unit,
}
Record is used to represent an electricity consumption measurement. Exporters expect the records passed to them to be monotonically increasing.
/// Sensor trait, the Sensor API.
pub trait Sensor {
    fn get_topology(&self) -> Box<Option<Topology>>;
    fn generate_topology(&self) -> Result<Topology, Box<dyn Error>>;
}
The Sensor trait is used by exporters to get an instance of a topology struct.
/// Defines methods for Record instances creation
/// and storage.
pub trait RecordGenerator {
    fn refresh_record(&mut self);
    fn get_records_passive(&self) -> Vec<Record>;
    fn clean_old_records(&mut self);
}
RecordGenerator is queried by exporters to obtain new records. RecordGenerator implementations are not specific to a sensor type, its purpose is to manage the record buffers of the Topology, CPUSocket and Domain structs (structs implement RecordGenerator within sensors/mod.rs). It uses the RecordReader trait to generate new records itself.
pub trait RecordReader {
    fn read_record(&self) -> Result<Record, Box<dyn Error>>;
}
RecordReader is responsible for obtaining measurements from the underlying sensor. The RecordReader trait is implemented within the specific sensor’s .rs file and accounts for the differing behavior between sensors.
/// Topology struct represents the whole CPUSocket architecture,
/// from the electricity consumption point of view,
/// including the potentially multiple CPUSocket sockets.
/// Owns a vector of CPUSocket structs representing each socket.
#[derive(Debug, Clone)]
pub struct Topology {
    /// The CPU sockets found on the host, represented as CPUSocket instances attached to this topology
    pub sockets: Vec<CPUSocket>,
    /// ProcessTrack instance that keeps track of processes running on the host and CPU stats associated
    pub proc_tracker: ProcessTracker,
    /// CPU usage stats buffer
    pub stat_buffer: Vec<CPUStat>,
    /// Measurements of energy usage, stored as Record instances
    pub record_buffer: Vec<Record>,
    /// Maximum size in memory for the recor_buffer
    pub buffer_max_kbytes: u16,
    /// Sorted list of all domains names
    pub domains_names: Option<Vec<String>>,
    /// Sensor-specific data needed in the topology
    pub _sensor_data: HashMap<String, String>,
}
The Topology struct implements RecordReader and RecordGenerator.
Exporters use it to query for records and can access its fields for more specific information.
The ProcessTracker field is particularly of note since it attributes energy consumption to individual processes.
The Topology struct is the main point of contact between sensors and exporters.
/// CPUSocket struct represents a CPU socket (matches physical_id attribute in /proc/cpuinfo),
/// owning CPU cores (processor in /proc/cpuinfo).
#[derive(Debug, Clone)]
pub struct CPUSocket {
    /// Numerical ID of the CPU socket (physical_id in /proc/cpuinfo)
    pub id: u16,
    /// RAPL domains attached to the socket
    pub domains: Vec<Domain>,
    /// Text attributes linked to that socket, found in /proc/cpuinfo
    pub attributes: Vec<Vec<HashMap<String, String>>>,
    /// Path to the file that provides the counter for energy consumed by the socket, in microjoules.
    pub counter_uj_path: String,
    /// Comsumption records measured and stored by scaphandre for this socket.
    pub record_buffer: Vec<Record>,
    /// Maximum size of the record_buffer in kilobytes.
    pub buffer_max_kbytes: u16,
    /// CPU cores (core_id in /proc/cpuinfo) attached to the socket.
    pub cpu_cores: Vec<CPUCore>,
    /// Usage statistics records stored for this socket.
    pub stat_buffer: Vec<CPUStat>,
    /// Sensor-specific data that has been stored at the topology generation step.
    #[allow(dead_code)]
    pub sensor_data: HashMap<String, String>,
}
This struct represents a CPUSocket. It implements both RecordGenerator and RecordReader. It can be accessed by exporters via the Topology struct to get CPUSocket specific records.
/// Domain struct represents a part of a CPUSocket from the
/// electricity consumption point of view.
#[derive(Debug, Clone)]
pub struct Domain {
    /// Numerical ID of the RAPL domain as indicated in /sys/class/powercap/intel-rapl* folders names
    pub id: u16,
    /// Name of the domain as found in /sys/class/powercap/intel-rapl:X:X/name
    pub name: String,
    /// Path to the domain's energy counter file, microjoules extracted
    pub counter_uj_path: String,
    /// History of energy consumption measurements, stored as Record instances
    pub record_buffer: Vec<Record>,
    /// Maximum size of record_buffer, in kilobytes
    pub buffer_max_kbytes: u16,
    /// Sensor-specific data that has been stored at the topology generation step.
    #[allow(dead_code)]
    sensor_data: HashMap<String, String>,
}
The Domain struct represents a part of the CPUSocket from the electricity consumption point of view, such as the core, uncore and DRAM. It implements RecordReader and RecordGenerator.
How everything fits together
The above diagram shows how exporters access records and information from the sensor structs.
- First the exporter uses the Sensor trait to get a topology struct.
- The sensor used (powercap_rapl, msr_rapl or another) is determined by a conditional compilation (
#[cfg(..)]). Only one sensor module can be included in the binary, otherwise there would be multiple RecordReader implementations. - The exporter calls the RecordGenerator trait on the Topology struct instance to retrieve records.
- For the RAPL-based sensors, the Topology struct queries records from its list of CPUSockets, which in turn query
Vec<Domain>for records.
Implementing A New Sensor
In essence, implementing a new sensor requires:
-
Adding a feature flag for the new sensor.
-
Creating a new module under src/sensors/ that:
- Defines a struct implementing the Sensor trait.
- Provides RecordReader implementations for Topology, CPUSocket, and Domain.
- Declare it as a module in sensors/mod.rs, gated behind conditional compilation.
-
Modifying the
build_sensorfunction in main.rs andget_default_sensorfunction in lib.rs to return the new sensor. -
Modifying the
#[cfg()]conditions to guard against conflicting trait implementations and fixing any resulting definition errors.
Explanations about host level power and energy metrics.
This is true starting from Scaphandre >= 1.0.
There are several metrics available at the host level in Scaphandre:
scaph_host_power_microwatts: always returned, computed from Record structs made fromscaph_host_energy_microjoulesmetricscaph_host_energy_microjoules: always returned, either one value or a sum of values coming directly from RAPL counters (energy_ujfiles or direct read from an MSR)scaph_host_rapl_psys_microjoules: is available only when the PSYS RAPL domain is available on the machine.
In addition to those metrics, you might want to build, on your time series database, the sum of process_ metrics to have a view of the weight of all processes on the host power. Using Prometheus, it would look like: sum(scaph_process_power_consumption_microwatts{hostname="$hostname"}) / 1000000, to get it in Watts.
Let’s explain the relationship between those metrics, and what you could expect.
host_power metric will return :
- If PSYS domain is available, a computed power coming from PSYS energy records
- If not, a computed power which is the sum of per-socket power (PKG RAPL domain) + DRAM RAPL domain power
Briefly explained (see RAPL domains for detailled explanations), PSYS covers most components on the machine (“all components connected to the SoC / motherboard” according to most documentations), so we return this wider ranged metric when available. If not we use a combination of PKG domain, that includes CPU and integrated GPU power, and DRAM domain, that includes memory power. The first options gives higher figures than the second, for now.
Suming the power of all processes, if the machine is mostly IDLE, you’ll get a tiny percentage of the host machine, most likely. The difference between host power and the sum of processes power can be accounted as “power due to IDLE activity”, in other words the power your machine demands for “doing nothing”. The higher this difference on a long period of time (better seen as a graph), the higher chance that there is room for improvement in moving the workloads to another machine and shut the current machine down (and make it available for another project or to another organization to prevent from buying a new machine).
Warning: that being said, the way per-process power is computed is still biased and shall be improved in the following versions of Scaphandre. For now, the main key for allocation is CPU time. As host level power metrics include power usage of more and more components on the machine (work in progress) this allocation key will be more and more inaccurate. Future versions of this allocation model should include keys regarding the activity of other components than CPU. Enabling a better set of allocation keys for per-process power is part of the roadmap.
How scaphandre computes per process power consumption
Scaphandre is a tool that makes it possible to see the power being used by a single process on a computer.
This sounds like a simple thing to be able to do, but in practice a number of details can make this more complex.
So having a good mental model of how it works will make it easier to understand when and how to use Scaphandre. Let’s start with a simplified mental model below, before moving on to multiple processors or virtual machines - but once you understand the key ideas outlined below, it’s easier to see how they can be applied to thinking about tracking power on virtual machines, or when multiple processors are available.
How a computer works on multiple jobs at the same time
When we first think about how much energy a single process running in a computer might use, we might start with a mental model that looks like the figure below, with large, uninterrupted chunks of compute time allocated to each process.
This is easy to understand, and it matches how we might be billed for a share of a larger machine when paying for cloud services.
Timesharing of work
However, if the reality was exactly like this diagram, our computers would only ever be able to do one thing at a time. It’s more accurate and helpful to think of computers working on lots of different jobs at the same time - they work on one job for short interval of time, then another, and another and so one. You’ll often see these small intervals of time referred to as jiffies.
In a given amount of time, some jobs that are prioritized or more resource intensive will use more jiffies than others. Fortunately, each job keeps a running total of the total jiffies allocated to it, so if we know how many jiffies have been used in total, it can give us an idea how much of a machine’s resources are being used by a given process.
Going from share of resources to actual power figures
It’s possible without Scaphandre to understand how large a share of a machines’ resources are being used by a given process.
This is useful, by itself, but if we want to understand how much power is used per process, not just the share of the machine’s resources, we need to know how much power is being used by the machine in absolute terms.
To do this, we need a sensor of some kind to track power usage by the machine itself. Some servers have these, like with Intel’s RAPL sensors, which we cover in more detail later on. This makes it possible to understand how much power is being used by CPUs, GPUs and so on, in terms of watts, or, if we are looking at just a single process, various fractions of a watt.
To understand the power used by a single process we combine both of these ideas. We count the jiffies used by our job when it’s being worked on, and for each jiffy, we check how much power is being drawn at those moments in time.
Finally, when we group together all the power readings for all our jiffies over a given time period, we can arrive at a usable figure for how much power has been used, in terms of watt hours.
Once we have a figure in terms of watt hours, there are various ways we can convert this to environmental impact. A common way is to use an emission factor for the electricity used, to turn the power consumption data into an estimate of associated carbon emissions.
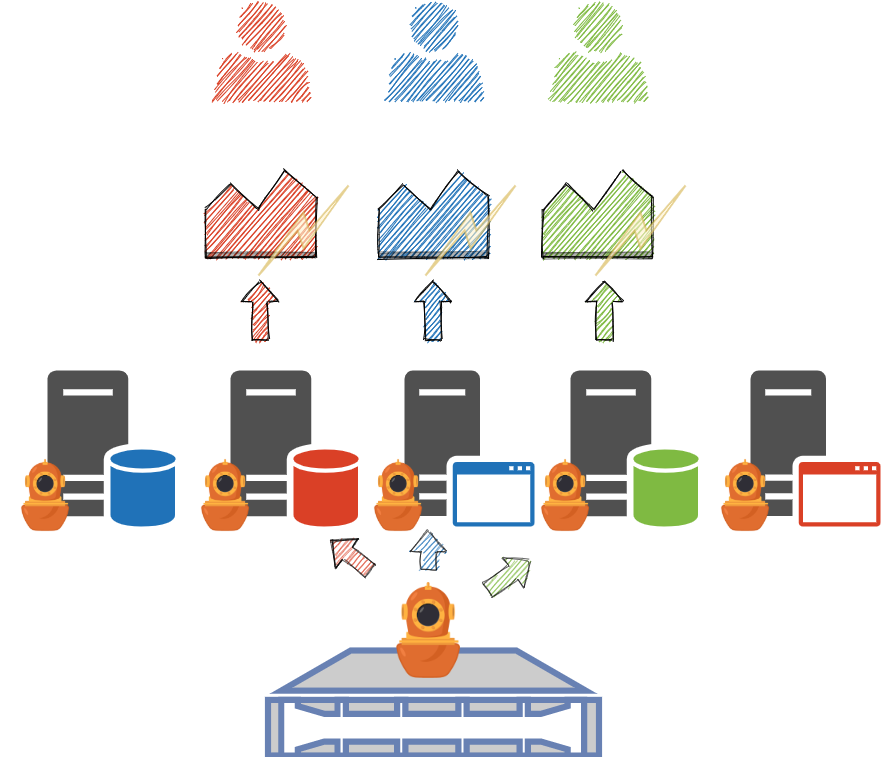
Working with virtualisation and multiple processors
While the reality is again more complicated than the diagram below, the same ideas broadly apply when you introduce multiple processors too.
If you are able to read from sensors that can share how much power is being used by the various processors at work, and know how much of the time is being allocated to our processes during those moments, you can get a good idea of what these figures are, at a per-process level.
Things get a bit more complicated with virtualised environments, because in many cases, virtual machines only have a partial view of the system they are part of, and frequently do not have access to any power usage figures from the host physical machine.
However, if a guest virtual machine or guest container does have access to readings provided by the host physical machine, it is possible to work out the same kinds of per-process power figures. Scaphandre supports exposing these kinds of power readings to virtual machines and containers, which means, if you are running on infrastructure that is running scaphandre and exposing these readings, you can see these figures for the energy used by your own processes.
More details about how Scaphandre works
As you can see with the prometheus exporter reference, scaphandre exporters can provide process level power consumption metrics. This section will explain how it is done and how it may be improved in the future.
Some details about RAPL
We’ll talk here about the case where scaphandre is able to effectively measure the power consumption of the host (see compatibility section for more on sensors and their prerequisites) and specifically about the PowercapRAPL sensor.
Let’s clarify what’s happening when you collect metrics with scaphandre and the RAPL sensor. RAPL stands for Running Average Power Limit. It’s a technology embedded in most Intel and AMD x86 CPUs produced after 2012.
Thanks to this technology it is possible to get the total energy consumption of the CPU, of the consumption per CPU socket, plus in some cases, the consumption of the DRAM controller. In most cases it represents the vast majority of the energy consumption of the machine (except when running GPU intensive workloads, for example).
Further improvements shall be made in scaphandre to fully measure the consumption when GPU are involved (or a lot of hard drives on the same host…).
Between scaphandre and this data is the powercap kernel module that writes the energy consumption to files. Scaphandre reads those files, stores the data in buffers and then allows for more processing through the exporters.
How to get the consumption of one process ?
The PowercapRAPL sensor does actually more than just collecting those energy consumption metrics (and converting them to power consumption metrics).
Every time the exporter asks for a measurement (either periodically like in the Stdout exporter, or every time a request comes as would be the case for the Prometheus exporter) the sensor reads the values of the energy counters from powercap. It then stores those values, and does the same for the CPU usage statistics of the CPU (the one you can see in /proc/stats) and for each running process on the machine at that time (see /proc/PID/stats).
With this data it is possible to compute the ratio of CPU time actively spent for a given PID on the CPU time actively spent doing something. With this ratio we can then get the subset of power consumption that is related to that PID on a given timeframe (between two measurement requests).
How to get the consumption of an application/a service ?
Services and programs are often not running on only one PID. It’s needed to aggregate the consumption of all related PIDs to know what this service is actually consuming.
To do that, in the current state of scaphandre development, you can use the Prometheus exporter, and then use Prometheus and its query language capabilities. You’ll find examples looking at the graphs and queries here. In a near future, more advanced features may be implemented in scaphandre to allow such classification even if you don’t have access to a proper Time Series database (TSDB).
Internal structure
Scaphandre is designed to be extensible. As it performs basically two tasks: collecting/pre-computing the power consumption metrics and publishing it, it is composed of two main components: a sensor and an exporter. Each can be implemented in different ways to match a certain use case. When you run scaphandre from the command line, -s allows you to choose the sensor you want to use, and the next subcommand is the name of the exporter.
Sensors
Sensors are meant to:
- get the power consumptions metrics of the host
- make it available for the exporter
The PowercapRAPL for instance, gets and transforms metrics coming from the powercap Linux kernel module, that serves as an interface to get the data from the RAPL feature of x86 CPUs. Because this feature is only accessible when you are running on a bare metal machine, this sensor will not work in a virtual machine, except if you first run scaphandre on the hypervisor and make the VM metrics available, with the qemu exporter, to scaphandre running inside the virtual machine.
When you don’t have access to the hypervisor/bare-metal machine (ie. when you run on public cloud instances and your provider doesn’t run scaphandre) you still have the option to estimate the power consumption, based on both the ressources (cpu/gpu/ram/io…) consumed by the virtual machine at a given time, and the characteristics of the underlying hardware. This is the way we are designing the future estimation-based sensor, to match that use case.
Looking at the code, you’ll find that the interface between metrics and the exporters is in fact the Topology object. This is intended to be asked by the exporter through the get_topology method of the sensor.
Exporters
An exporter is expected to:
- ask the sensors to get new metrics and store them for later, potential usage
- export the current metrics
The Stdout exporter exposes the metrics on the standard output (in your terminal). The prometheus exporter exposes the metrics on an HTTP endpoint, to be scraped by a prometheus instance. An exporter should be created for each monitoring scenario (do you want to feed your favorite monitoring/data analysis tool with scaphandre metrics ? feel free to open a PR to create a new exporter !).
As introduced in the sensors section, the Qemu exporter, is very specific. It is only intended to collect metrics related to running virtual machines on a Qemu/KVM hypervisor. Those metrics can then be made available to each virtual machine and their own scaphandre instance, running the PowercapRAPL sensor (with the --vm flag on). The qemu exporter puts VM’s metrics in files the same way the powercap kernel module does it. It mimics this behavior, so the sensor can act the same way it would on a bare metal machine.
About containers
There are several ways scaphandre can interact with containers.
You may run scaphandre in a container, to not have to manage the dependencies, then measure the power consumption of the bare metal host. This is described in the quickstart tutorial. Note that you need to expose /sys/class/powercap and /proc as volumes in the container to allow scaphandre to get the relevant metrics from the bare metal host.
Scaphandre may help you measure the power consumption of containers running on a given host. You can already get to that goal using the tips provided in the howto section called “Get process level power consumption”. It may still require some tweaking and inventiveness from you in making the approriate queries to your favorite TSDB. This should be made easier by the upcoming scaphandre features.
Another use case scenario is measuring the power consumption of a container orchestrator (like kubernetes), its nodes and the containers and applications running on it. Scaphandre can be installed on Kubernetes via the Helm chart and there is a tutorial for installing it along with Prometheus and Grafana to view the metrics.
As described here, scaphandre provides several ways (sensors) to collect the power consumption metrics. Depending on your use case a sensor should be more suitable than the other. Each of them comes with strengths and weaknesses. This is basically always a tradeoff between precision and simplicity. This is especially true if you run a container-based workloads on public cloud instances. We are working to provide a solution for that as well.
Explanation on RAPL / Running Average Power Limit domains: what we (think we) know so far
RAPL stands for “Running Average Power Limit”, it is a feature on Intel/AMD x86 CPU’s (manufactured after 2012) that allows to set limits on power used by the CPU and other components. This feature also allows to just get “measurements” (mind the double quotes, as at least part of the numbers RAPL gives are coming from estimations/modeling) of components power usage.
It is composed of “domains”, that, in 2023, may include:
- Core/PP0: Energy consumed by the CPU Cores themselves.
- Uncore/PP1: Energy consumed by components close to the CPU : most of the time it means the embedded GPU chipset.
- Dram: Energy consumed by the memory/RAM sticks
- Package/PKG: Includes “Core” and “Uncore”. In some documentations and in some of our experiments it seem to include “Dram”, but this doesn’t seem true in every cases.
- PSys: We don’t have a clear understanding on this one (yet). But most documentations refer to it with words similar to “PSys: (introduced with Intel Skylake) monitors and controls the thermal and power specifications of the entire SoC and it is useful especially when the source of the power consumption is neither the CPU nor the GPU. For multi-socket server systems, each socket reports its own RAPL values.”. To summarize, Psys seems like an interesting metric to get energy consumed by a motherboard and connected components (which includes RAPL usual suspects but also WiFi/Bluetooth cards and probably more). If you want to know more about this metric, we gathered references/sources here. If you want to help us understanding and documenting better this metric, please consider constributing to the Energizta project.
RAPL documentation from Intel doesn’t necessarily give very precise informations about how RAPL behaves depending on the platform, or about what is included in the calculation. Actively looking for other experimentations/feedbacks/documentations is needed. You might find some informations gathered here: awesome-energy. If you have more or more precise informations and are willing to contribute, don’t hesitate to open a PR to dev branch on scaphandre’s repository (targeting docs_src folder) and/or the awesome-energy repository.
If you want to know if RAPL is supported by your CPU, please have a look to the end of the Compatibility section.
Metrics exposed by Scaphandre
With Stdout exporter, you can see all metrics available on your machine with flag --raw-metrics.
With prometheus exporter, all metrics have a HELP section provided on /metrics (or whatever suffix you choosed to expose them).
Here are some key metrics that you will most probably be interested in:
scaph_host_power_microwatts: Aggregation of several measurements to give a try on the power usage of the the whole host, in microwatts (GAUGE). It might be the same as RAPL PSYS (see RAPL domains) measurement if available, or a combination of RAPL PKG and DRAM domains + an estimation of other hardware componentes power usage.scaph_process_power_consumption_microwatts{exe="$PROCESS_EXE",pid="$PROCESS_PID",cmdline="path/to/exe --and-maybe-options"}: Power consumption due to the process, measured on at the topology level, in microwatts. PROCESS_EXE being the name of the executable and PROCESS_PID being the pid of the process. (GAUGE)
For more details on that metric labels, see this section.
And some more deep metrics that you may want if you need to make more complex calculations and data processing:
scaph_host_energy_microjoules: Energy measurement for the whole host, as extracted from the sensor, in microjoules. (COUNTER)scaph_socket_power_microwatts{socket_id="$SOCKET_ID"}: Power measurement relative to a CPU socket, in microwatts. SOCKET_ID being the socket numerical id (GAUGE)
If your machine provides RAPL PSYS domain (see RAPL domains), you can get the raw energy counter for PSYS/platform with scaph_host_rapl_psys_microjoules. Note that scaph_host_power_microwatts is based on this PSYS counter if it is available.
Since 1.0.0 the following host metrics are availalable as well ;
scaph_host_swap_total_bytes: Total swap space on the host, in bytes.scaph_host_swap_free_bytes: Swap space free to be used on the host, in bytes.scaph_host_memory_free_bytes: Random Access Memory free to be used (not reused) on the host, in bytes.scaph_host_memory_available_bytes: Random Access Memory available to be re-used on the host, in bytes.scaph_host_memory_total_bytes: Random Access Memory installed on the host, in bytes.scaph_host_disk_total_bytes: Total disk size, in bytes.scaph_host_disk_available_bytes: Available disk space, in bytes.
Disk metrics have the following labels : disk_file_system, disk_is_removable, disk_type, disk_mount_point, disk_name
scaph_host_cpu_frequency: Global frequency of all the cpus. In MegaHertzscaph_host_load_avg_fifteen: Load average on 15 minutes.scaph_host_load_avg_five: Load average on 5 minutes.scaph_host_load_avg_one: Load average on 1 minute.
If you hack scaph or just want to investigate its behavior, you may be interested in some internal metrics:
-
scaph_self_memory_bytes: Scaphandre memory usage, in bytes -
scaph_self_memory_virtual_bytes: Scaphandre virtual memory usage, in bytes -
scaph_self_topo_stats_nb: Number of CPUStat traces stored for the host -
scaph_self_topo_records_nb: Number of energy consumption Records stored for the host -
scaph_self_topo_procs_nb: Number of processes monitored by scaph -
scaph_self_socket_stats_nb{socket_id="SOCKET_ID"}: Number of CPUStat traces stored for each socket -
scaph_self_socket_records_nb{socket_id="SOCKET_ID"}: Number of energy consumption Records stored for each socket, with SOCKET_ID being the id of the socket measured -
scaph_self_domain_records_nb{socket_id="SOCKET_ID",rapl_domain_name="RAPL_DOMAIN_NAME "}: Number of energy consumption Records stored for a Domain, where SOCKET_ID identifies the socket and RAPL_DOMAIN_NAME identifies the rapl domain measured on that socket
Getting per process data with scaph_process_* metrics
Here are available labels for the scaph_process_power_consumption_microwatts metric that you may need to extract the data you need:
exe: is the name of the executable that is the origin of that process. This is good to be used when your application is running one or only a few processes.cmdline: this contains the whole command line with the executable path and its parameters (concatenated). You can filter on this label by using prometheus=~operator to match a regular expression pattern. This is very practical in many situations.instance: this is a prometheus generated label to enable you to filter the metrics by the originating host. This is very useful when you monitor distributed services, so that you can not only sum the metrics for the same service on the different hosts but also see what instance of that service is consuming the most, or notice differences beteween hosts that may not have the same hardware, and so on…pid: is the process id, which is useful if you want to track a specific process and have your eyes on what’s happening on the host, but not so practical to use in a more general use case
Since 1.0.0 the following per-process metrics are available as well :
scaph_process_cpu_usage_percentage: CPU time consumed by the process, as a percentage of the capacity of all the CPU Coresscaph_process_memory_bytes: Physical RAM usage by the process, in bytesscaph_process_memory_virtual_bytes: Virtual RAM usage by the process, in bytesscaph_process_disk_total_write_bytes: Total data written on disk by the process, in bytesscaph_process_disk_write_bytes: Data written on disk by the process, in bytesscaph_process_disk_read_bytes: Data read on disk by the process, in bytesscaph_process_disk_total_read_bytes: Total data read on disk by the process, in bytes
Get container-specific labels on scaph_process_* metrics
The flag –containers enables Scaphandre to collect data about the running Docker containers or Kubernetes pods on the local machine. This way, it adds specific labels to make filtering processes power consumption metrics by their encapsulation in containers easier.
Generic labels help to identify the container runtime and scheduler used (based on the content of /proc/PID/cgroup):
container_scheduler: possible values are docker or kubernetes. If this label is not attached to the metric, it means that scaphandre didn’t manage to identify the container scheduler based on cgroups data.
Then the label container_runtime could be attached. The only possible value for now is containerd.
container_id is the ID scaphandre got from /proc/PID/cgroup for that container.
For Docker containers (if container_scheduler is set), available labels are :
container_names: is a string containing names attached to that container, according to the docker daemoncontainer_docker_version: version of the docker daemoncontainer_label_maintainer: content of the maintainer field for this container
For containers coming from a docker-compose file, there are a bunch of labels related to data coming from the docker daemon:
container_label_com_docker_compose_project_working_dircontainer_label_com_docker_compose_container_numbercontainer_label_com_docker_compose_project_config_filescontainer_label_com_docker_compose_versioncontainer_label_com_docker_compose_servicecontainer_label_com_docker_compose_oneoff
For Kubernetes pods (if container_scheduler is set), available labels are :
kubernetes_node_name: identifies the name of the kubernetes node scaphandre is running onkubernetes_pod_name: the name of the pod the container belongs tokubernetes_pod_namespace: the namespace of the pod the container belongs to
JSON exporter
Usage
You can launch the JSON exporter this way (running the default powercap_rapl sensor):
scaphandre json
Default behavior is to measure and show metrics periodically during 10 seconds. You can change that timeout with -t. Here is how to display metrics during one minute:
scaphandre json -t 60
You can change as well the step measure duration with -s. Here is how to display metrics during one minutes with a 5s step:
scaphandre json -t 60 -s 5
If you want a faster interval you can use option -n (for nano seconds). Here is how to display metrics during 10s with a 100ms step:
scaphandre json -t 10 -s 0 -n 100000000
By default, JSON is printed in the terminal, to write result in a file you can provide a path with option -f:
scaphandre json -t 10 -s 0 -n 100000000 -f report.json
To get informations about processes that are running in containers, add --containers:
scaphandre --no-header json --containers --max-top-consumers=15 | jq
Since 1.0.0 you can filter the processes, either by their process name with --process-regex, or by the name of the container they run in with --container-regex (needs the flag --containers to be active as well).
As always exporter’s options can be displayed with -h:
Write the metrics in the JSON format to a file or to stdout

Usage: scaphandre json [OPTIONS]

Options:
  -t, --timeout <TIMEOUT>
          Maximum time spent measuring, in seconds. If unspecified, runs forever
  -s, --step <SECONDS>
          Interval between two measurements, in seconds [default: 2]
      --step-nano <NANOSECS>
          Additional step duration in _nano_ seconds. This is added to `step` to get the final duration [default: 0]
      --max-top-consumers <MAX_TOP_CONSUMERS>
          Maximum number of processes to watch [default: 10]
  -f, --file <FILE>
          Destination file for the report (if absent, print the report to stdout)
      --containers
          Monitor and apply labels for processes running as containers
      --process-regex <PROCESS_REGEX>
          Filter processes based on regular expressions (example: 'scaph\\w\\w.e')
      --container-regex <CONTAINER_REGEX>
          Filter containers based on regular expressions
      --resources
          Monitor and incude CPU, RAM and Disk usage per process
  -h, --help
          Print help
Metrics provided Scaphandre are documented here.
Prometheus exporter

Usage
You can launch the prometheus exporter this way (running the default powercap_rapl sensor):
scaphandre prometheus
As always exporter’s options can be displayed with -h:
	scaphandre prometheus -h
	scaphandre-prometheus
	Prometheus exporter exposes power consumption metrics on an http endpoint (/metrics is default) in prometheus accepted
	format

	USAGE:
		scaphandre prometheus [FLAGS] [OPTIONS]

	FLAGS:
        --containers    Monitor and apply labels for processes running as containers
		-h, --help       Prints help information
		-q, --qemu       Instruct that scaphandre is running on an hypervisor
		-V, --version    Prints version information

	OPTIONS:
		-a, --address <address>    ipv6 or ipv4 address to expose the service to [default: ::]
		-p, --port <port>          TCP port number to expose the service [default: 8080]
		-s, --suffix <suffix>      url suffix to access metrics [default: metrics]
With default options values, the metrics are exposed on http://localhost:8080/metrics.
Use -q or –qemu option if you are running scaphandre on a hypervisor. In that case a label with the vm name will be added to all qemu-system* processes.
This will allow to easily create charts consumption for each vm and defined which one is the top contributor.
Metrics provided Scaphandre are documented here.
PrometheusPush Exporter for Prometheus Push Gateway
Usage
You can launch the prometheus exporter this way:
scaphandre prometheus-push
As always exporter’s options can be displayed with -h:
	scaphandre prometheus-push -h
	Push metrics to Prometheus Push Gateway

	Usage: scaphandre prometheus-push [OPTIONS]

	Options:
	  -H, --host <HOST>      IP address (v4 or v6) of the metrics endpoint for Prometheus [default: localhost]
	  -p, --port <PORT>      TCP port of the metrics endpoint for Prometheus [default: 9091]
	      --suffix <SUFFIX>  [default: metrics]
	  -S, --scheme <SCHEME>  [default: http]
	  -s, --step <STEP>      [default: 5]
	      --qemu             Apply labels to metrics of processes that look like a Qemu/KVM virtual machine
	      --containers       Apply labels to metrics of processes running as containers
	  -j, --job <JOB>        Job name to apply as a label for pushed metrics [default: scaphandre]
	      --no-tls-check     Don't verify remote TLS certificate (works with --scheme="https")
	  -h, --help             Print help
With default options values, the metrics are sent to http://localhost:9091/metrics
Metrics exposed
Metrics exposed are the same as the Prometheus (pull mode) exporter.
Push gateway’s grouping key for each host is in the form job/scaphandre/instance/${HOSTNAME} with HOSTNAME being the hostname of the host sending metrics.
Qemu exporter
Computes energy consumption metrics for each Qemu/KVM virtual machine found on the host. Exposes those metrics as filetrees compatible with the powercap_rapl sensor.
Note that this is still experimental. Metrics are already considered trustworthy, but there are discussions and tests to be performed about the acceptable ways to share the data with the guests/vms. Any feedback or thoughts about this are welcome. Please refer to the contributing section.
Usage
-
Run the scaphandre with the qemu exporter on your bare metal hypervisor machine:
scaphandre qemu # this is suitable for a test, please run it as a systemd service for a production setup -
Default is to expose virtual machines metrics in
/var/lib/libvirt/scaphandre/${DOMAIN_NAME}withDOMAIN_NAMEbeing the libvirt domain name of the virtual machine. First create a tmpfs mount point to isolate metrics for that virtual machine:mount -t tmpfs tmpfs_DOMAIN_NAME /var/lib/libvirt/scaphandre/DOMAIN_NAME -o size=10m -
Ensure you expose the content of this folder to the virtual machine by having this configuration in the xml configuration of the domain:
		<filesystem type='mount' accessmode='passthrough'>
	      <driver type='virtiofs'/>
	      <source dir='/var/lib/libvirt/scaphandre/DOMAIN_NAME'/>
	      <target dir='scaphandre'/>
		  <readonly />
	    </filesystem>
You can edit the vm properties using
sudo virsh edit <DOMAIN_NAME>using your usual editor. But it is more convenient to use virtual-manager, as explained in the following screenshots.It also helps to define the correct syntax which probably depends from the qemu version. You can check that the above configuration is slightly different form the one below.
a. Right click in the hardware menu:
b. Enter the following parameters:
c. XML generated as a result:
-
Ensure the VM has been started once the configuration is applied, then mount the filesystem on the VM/guest:
mount -t 9p -o trans=virtio scaphandre /var/scaphandre -
Still in the guest, run scaphandre in VM mode with the default sensor:
scaphandre --vm prometheus -
Collect your virtual machine specific power usage metrics. (requesting http://VM_IP:8080/metrics in this example, using the prometheus exporter)
-
Riemann exporter
Usage
You can launch the Riemann exporter this way (running the default powercap_rapl sensor):
scaphandre riemann
As always exporter’s options can be displayed with -h:
Expose the metrics to a Riemann server

Usage: scaphandre riemann [OPTIONS]

Options:
  -a, --address <ADDRESS>
          Address of the Riemann server. If mTLS is used this must be the server's FQDN [default: localhost]
  -p, --port <PORT>
          TCP port number of the Riemann server [default: 5555]
  -d, --dispatch-interval <DISPATCH_INTERVAL>
          Duration between each metric dispatch, in seconds [default: 5]
  -q, --qemu
          Apply labels to metrics of processes looking like a Qemu/KVM virtual machine
      --containers
          Monitor and apply labels for processes running as containers
      --mtls
          Connect to Riemann using mTLS instead of plain TCP
      --ca <CA_FILE>
          CA certificate file (.pem format)
      --cert <CERT_FILE>
          Client certificate file (.pem format)
      --key <KEY_FILE>
          Client RSA key file
  -h, --help
          Print help
With default options values, the metrics are sent to http://localhost:5555 every 5 seconds
Use --mtls option to connect to a Riemann server using mTLS. In such case, you must provide the following parameters:
--addressto specify the fqdn of the Riemann server.--cato specify the CA that authenticate the Riemann server.--certto specify the client certificate.--keyto specify the RSA key to be used by the client certificate.
Use -q or --qemu option if you are running scaphandre on a hypervisor. In that case a label with the vm name will be added to all qemu-system* processes.
This will allow to easily create charts consumption for each vm and defined which one is the top contributor.
Troubleshooting note: run Scaphandre using -vv parameter. If Scaphandre is stuck on the Send data log event, ensure you are connecting the Riemann server using a TLS port (5554 in the below example).
As a reference here is a Riemann configuration:
; -*- mode: clojure; -*-
; vim: filetype=clojure

(logging/init {:file "riemann.log"})

; Listen on the local interface over TCP (5555), UDP (5555), TLS/TCP (5554)  and websockets
; (5556)
(let [host "0.0.0.0"]
  (tcp-server {:host host})
  (tcp-server {:host host
               :port 5554
               :tls? true
               :key "/client.key.pkcs8"
               :cert "/client.pem"
               :ca-cert "/CA.pem"})
  (udp-server {:host host})
  (ws-server  {:host host}))

; Expire old events from the index every 5 seconds.
(periodically-expire 5)

(let [index (index)]
  ; Inbound events will be passed to these streams:
  (streams
    (default :ttl 60
      ; Index all events immediately.
      index

      ; Log expired events.
      (expired
        (fn [event] (info "expired" event))))))
Metrics exposed
Metrics provided Scaphandre are documented here.
There is only one exception about process_power_consumption_microwatts each process has a service name process_power_consumption_microwatts_pid_exe.
As an example, process consumption can be retrieved using the following Riemann query:
(service =~ "process_power_consumption_microwatts_%_firefox") or (service =~ "process_power_consumption_microwatts_%_scaphandre")
Stdout exporter
Usage
You can launch the stdout exporter this way (running the default powercap_rapl sensor):
scaphandre stdout
Default behavior is to measure and show metrics periodically during 10 seconds. You can change that timeout with -t.
A value of -t 0 will display top consumers infinitely and must be interrupted with ctrl-c.
Here is how to display metrics during one minute:
scaphandre stdout -t 60
You can change as well the step measure duration with -s. Here is how to display metrics during one minutes with a 5s step:
scaphandre stdout -t 60 -s 5
You can change the number of top consumers displayed with -p. Here is how to display the first 20 top consumers:
scaphandre stdout -p 20
You can filter the processes to display with -r. A warning will be risen if this option is used with -p at the same time.
In such case, -p behavior is disabled.
The -r expected parameter is a regular expression. Details can be found here and tested here.
Here is how to display power data for the ‘scaphandre’ process:
scaphandre stdout -r 'scaphandre'
Metrics provided Scaphandre are documented here.
Since 1.0.0 the flag --raw-metrics displays all metrics available for the host, as a parseable list. This might be useful to list metrics that you would like to fetch afterwards in your monitoring dashboard. Without this flag enabled, Stdout exporter has it’s own format and might not show you all available metrics.
As always exporter’s options can be displayed with -h:
Write the metrics to the terminal

Usage: scaphandre stdout [OPTIONS]

Options:
  -t, --timeout <TIMEOUT>            Maximum time spent measuring, in seconds. If negative, runs forever [default: 10]
  -s, --step <SECONDS>               Interval between two measurements, in seconds [default: 2]
  -p, --processes <PROCESSES>        Maximum number of processes to display [default: 5]
  -r, --regex-filter <REGEX_FILTER>  Filter processes based on regular expressions (example: 'scaph\\w\\w.e')
      --containers                   Monitor and apply labels for processes running as containers
  -q, --qemu                         Apply labels to metrics of processes looking like a Qemu/KVM virtual machine
      --raw-metrics                  Display metrics with their names
  -h, --help                         Print help
Warp10 exporter
Usage
You can launch the Warp10 exporter this way (running the default powercap_rapl sensor):
scaphandre warp10
You need a token to be able to push data to a warp10 instance.
The SCAPH_WARP10_WRITE_TOKEN env var can be used to make it available to scaphandre.
Please refer to the warp10 documentation to know how to get the token in the first place.
As always exporter’s options can be displayed with -h:
Expose the metrics to a Warp10 host, through HTTP

Usage: scaphandre warpten [OPTIONS]

Options:
  -H, --host <HOST>                FQDN or IP address of the Warp10 instance [default: localhost]
  -p, --port <PORT>                TCP port of the Warp10 instance [default: 8080]
  -S, --scheme <SCHEME>            "http" or "https" [default: http]
  -t, --write-token <WRITE_TOKEN>  Auth token to write data to Warp10. If not specified, you must set the env variable SCAPH_WARP10_WRITE_TOKEN
  -s, --step <SECONDS>             Interval between two measurements, in seconds [default: 2]
  -q, --qemu                       Apply labels to metrics of processes looking like a Qemu/KVM virtual machine
  -h, --help                       Print help
With default options values, the metrics are sent to http://localhost:8080 every 60 seconds
Use -q or –qemu option if you are running scaphandre on a hypervisor. In that case a label with the vm name will be added to all qemu-system* processes.
This will allow to easily create charts consumption for each vm and defined which one is the top contributor.
Metrics provided Scaphandre are documented here.
MSR_RAPL sensor
Pre-requesites
At the time those lines are written, this sensor works only on:
- OS: Windows 10/Windows Server 2016, Windows Server 2019
- Intel and AMD x86 CPUs, produced after 2012 (or some laptop cpu prior to 2012)
This sensor needs the RAPL MSR-based driver to be installed.
Usage
To explicitely call the powercap_rapl sensor from the command line use:
scaphandre -s msr_rapl EXPORTER # EXPORTER being the exporter name you want to use
You can see arguments available from the cli for this sensors with:
scaphandre -s msr_rapl -h
Please refer to doc.rs code documentation for more details.
Options available
TODO
Environment variables
TODO
Troubleshooting
TODO
Powercap_rapl sensor
Pre-requesites
At the time those lines are written, this sensor works only on:
- OS: GNU/Linux
- Intel and AMD x86 CPUs, produced after 2012 (or some laptop cpu prior to 2012)
It needs the following kernel modules to be present and running:
On kernels 5.0 or later: intel_rapl_common
On kernel prior 5.0: intel_rapl
For AMD processors, it seems that powercap/rapl will work only since kernel 5.8 and 5.11 for family 19h.
Energy consumption data can be directly collected on a physical machine only.
To collect energy consumption on a virtual machine, you may first collect power consumption data from the hypervisor thanks to the qemu exporter and then collect those metrics in the virtual machine thanks to this sensor, with --vm flag enabled.
Usage
To explicitely call the powercap_rapl sensor from the command line use:
scaphandre -s powercap_rapl EXPORTER # EXPORTER being the exporter name you want to use
You can see arguments available from the cli for this sensors with:
scaphandre -s powercap_rapl -h
If running in a virtual machine:
scaphandre --vm -s powercap_rapl EXPORTER
Please refer to doc.rs code documentation for more details.
Options available
sensor-buffer-per-socket-max-kB: Maximum memory size allowed, in KiloBytes, for storing energy consumption for each socketsensor-buffer-per-domain-max-kB: Maximum memory size allowed, in KiloBytes, for storing energy consumption for each domain
Environment variables
If in --vm mode, you want to read metrics from another path than the default /var/scaphandre, set env var SCAPHANDRE_POWERCAP_PATH with the desired path.
Troubleshooting
When running scaphandre on Ubuntu 20.xx I get a permission denied error
Since linux kernel package 5.4.0-53.59 in debian/ubuntu, powercap attributes are only accessible by root:
linux (5.4.0-53.59) focal; urgency=medium

  * CVE-2020-8694
    - powercap: make attributes only readable by root
Therefor, the user running scaphandre needs to have read access to energy_uj files in /sys/class/powercap.
You can run the init.sh script to apply appropriate permissions to the required files.
Why ?
We are facing the biggest challenge of mankind history: to make our activities sustainable enough to not jeopardize our future.
To match the Paris agreement objective of not going further than +2 Celcius degrees on average in 2100, we need to transform our industries. The tech industry is no exception and we need to make sure that its benefits are not cancelled (or worse) by its negative impact.
Measuring power consumption in tech services infrastructures is not as easy as it seems. We often rely on physical devices to do that and need to build in-house data pipelines to get those metrics useful. Furthermore this doesn’t give fine-grained data regarding applications/processes power consumption but only the host power consumption. This is even harder in a virtualization environment or as public cloud customers.
Even recent scientific researches about tech energy consumption rely on statistical, both large and narrowed scale, assumptions-based data (because it’s all we’ve got). Despite their weaknesses, they also all agree on the fact that the current consumption of datacenters and the Internet will increase drastically in the following years.
Scaphandre aims to initiate a collaboration of tech companies and enthusiasts to provide an easy, lightweight, robust and well-understood way to precisely measure the energy consumption and make it useful to take soberness decisions.
Note that the greenhouse gas emissions related to this energy consumption depends on the energy mix of your country. You may find valuable data about that on Electricity Map.
Compatibility
Scaphandre intends to provide multiple ways to gather power consumption metrics and make understanding tech services footprint possible in many situations. Depending on how you use scaphandre, you may have some restrictions.
To summarize, scaphandre should provide two ways to estimate the power consumption of a service, process or machine. Either by measuring it, using software interfaces that give access to hardware metrics, or by estimating it if measuring is not an option (this is a planned feature, not yet implemented as those lines are written, in december 2020).
In scaphandre, the code responsible to collect the power consumption data before any further processing is grouped in components called sensors. If you want more details about scaphandre structure, here are the explanations.
On GNU/Linux PowercapRAPL sensor enables you to measure the power consumption, but it doesn’t work in all contexts.
On Windows, the MsrRAPL sensor, coupled with the driver responsible to read RAPL MSR’s enables you to do (almost) the same.
| Sensor | Intel x86 bare metal | AMD x86 bare metal | ARM bare metal | Virtual Machine | Public cloud instance | Container |
|---|---|---|---|---|---|---|
| PowercapRAPL (GNU/Linux only) | Yes | Yes ⚠️ kernel > 5.11 required | We don’t know yet | Yes, if on a qemu/KVM hypervisor that runs scaphandre and the Qemu exporter | No, until your cloud provider uses scaphandre on its hypervisors | Depends on what you want |
| MsrRAPL (Windows only) | Yes | Probable yes (not tested yet, if you have windows operated AMD gear, please consider contributing | No | Not yet, depends on improvements on the MsrRAPL sensors and overall windows/hypervisors support in Scaphandre | No, until your cloud provider uses scaphandre on its hypervisors | Might work, not tested yet. If you want to join us in this journey, please consider contributing |
| Future estimation based sensor | Future Yes | Future Yes | Future Yes | Future Yes | Future Yes | Future Yes |
Checking RAPL is available on your CPU
Sensors including “RAPL” in their name rely on RAPL.
The pts and pln feature flags (“Intel Package Thermal Status” and “Intel Power Limit Notification” respectively) seem to indicate that RAPL is supported on a CPU. On GNU/Linux, you could be sure of their presence, if this command succeds and matches :
egrep "(pts|pln)" /proc/cpuinfo
Troubleshooting
I get a permission denied error when I run scaphandre, no matter what is the exporter
Since Linux kernel 5.10 (late 2020), the energy counters files that the PowercapRAPL sensor uses, are owned by root.
To ensure this is your issue and fix that quickly you can run the init.sh script:
bash init.sh
Then run scaphandre. If it does not work, the issue is somewhere else.
I get a no such device error, the intel_rapl of intel_rapl_common kernel modules are present
It can mean that your cpu doesn’t support RAPL. Please refer to the compatibility section to be sure.
I can’t mount the required kernel modules, getting a Couldn't find XXX modules error
If you are in a situation comparable to this one, you may need to install additional packages.
On ubuntu 20.01 and 20.10, try to install linux-modules-extra-$(uname -r) with apt. Then you should be able to modprobe intel_rapl_common.
On an AMD cpu machine, I get the following stracktrace
scaphandre::sensors::powercap_rapl: Couldn't find intel_rapl modules.
thread 'main' panicked at 'Trick: if you are running on a vm, do not forget to use --vm parameter invoking scaphandre at the command line', src/sensors/mod.rs:238:18
stack backtrace:
   0: rust_begin_unwind
             at /build/rust/src/rustc-1.49.0-src/library/std/src/panicking.rs:495:5
   1: core::panicking::panic_fmt
             at /build/rust/src/rustc-1.49.0-src/library/core/src/panicking.rs:92:14
   2: core::option::expect_failed
             at /build/rust/src/rustc-1.49.0-src/library/core/src/option.rs:1260:5
   3: core::option::Option<T>::expect
             at /build/rust/src/rustc-1.49.0-src/library/core/src/option.rs:349:21
   4: scaphandre::sensors::Topology::add_cpu_cores
             at ./src/sensors/mod.rs:234:26
   5: <scaphandre::sensors::powercap_rapl::PowercapRAPLSensor as scaphandre::sensors::Sensor>::generate_topology
             at ./src/sensors/powercap_rapl.rs:106:9
   6: <scaphandre::sensors::powercap_rapl::PowercapRAPLSensor as scaphandre::sensors::Sensor>::get_topology
             at ./src/sensors/powercap_rapl.rs:112:24
   7: scaphandre::exporters::stdout::StdoutExporter::new
             at ./src/exporters/stdout.rs:51:30
   8: scaphandre::run
             at ./src/lib.rs:60:28
   9: scaphandre::main
             at ./src/main.rs:91:5
  10: core::ops::function::FnOnce::call_once
             at /build/rust/src/rustc-1.49.0-src/library/core/src/ops/function.rs:227:5
note: Some details are omitted, run with `RUST_BACKTRACE=full` for a verbose backtrace.
We verified that scaphandre (and especially the powercap_rapl sensor) works on AMD Zen processors with a Linux kernel 5.11 or later. Before that kernel version, it won’t probably work as the drivers needed to feed powercap with rapl data are not present.
Trying to build the project I get this error
error: linker `cc` not found
  |
  = note: No such file or directory (os error 2)

error: aborting due to previous error

error: could not compile `log`
You need compiling tooling. On Ubuntu/Debian, run:
sudo apt install build-essential
Contributing guide
If you are reading this, you may be to contribute. Just for that, a big thank you ! 👏
Feel free to propose pull requests, or open new discussions or issues at will. Scaphandre is a collaborative project and all opinions and propositions shall be heard and studied. The contributions will be received with kindness, gratitude and with an open mind. Remember that we are all dwarfs standing on the shoulders of giants. We all have to learn from others and to give back, with due mutual respect.
Code of conduct
This project adheres to the Rust Code of Conduct, which can be found here.
Ways to contribute
Contributions may take multiple forms:
- 💻 code, of course, but not only (there is a lot more !)
- 📖 documentation : here is a guide to edit and build the documentation
- 🎤 Any help on communication: writing blog posts, speaking about scaphandre in conferences, speaking and writing about the responsibility of tech to be sustainable as well !
- 🧬 structuring the project and the community is also a very important topic. Feel free to propose help, or start discussions about that.
This project intends to unite a lot of people to have a lot of positive impact. Any action going helping us to get there will be very much appreciated ! 🎉
Contact
Discussions and questions about the project are welcome on gitter or by email.
Contribution guidelines
This project intends to use conventional commit messages and the gitflow workflow.
Please open your pull requests on the dev branch :)
Scaphandre is a not only a tool, but a framework. Modules dedicated to collect energy consumption data from the host are called Sensors. Modules that are dedicated to send this data to a given channel or remote system are called Exporters. New Sensors and Exporters are going to be created and all contributions are welcome. For more on the internal structure please jump here.
Edit and build the documentation
Documentation source files are in docs_src, edit the content there and propose pull-requests on the scaphandre repository as if it was a code pull-request.
Here is how to build and publish the documentation after a change. First download mdbook, the static site generator we use for the documentation website:
cargo install mdbook
Then fork the scaphandre-documentation repository and clone the resulting repository locally.
Place the resulting documentation folder next to scaphandre’s folder. Then run the build:
cd scaphandre && mdbook build
You should then have the result in scaphandre-documentation/docs. Commit, push and propose a PR to publish the changes.
You can also serve the current content locally to see your changes before commit:
mdbook serve
Additional references for documentation
- /proc/stat explained
- Gathering CPU utilization from /proc/stat
- proc filesystem documentation
- CPU usage on Linux
- Using RAPL to read PP0 and DRAM energy on Haswell
- RAPL reference
- How to measure linux performance avoiding most typical mistakes: CPU
- How to calculate cpu utilization
Powercap/RAPL source code in the kernel
- arch/x86/events/intel/rapl.c
- drivers/powercap